My first grasp of the internet was all about free music, a user-sharing service called Napster, and a media player called Winamp.
That was then; the internet now feels like a vast blackhole of information, promising to create chaos as well as the opportunity to tackle the greatest challenges of our time, like climate change, natural disasters, and wildlife conservation.
The internet does make me feel very very small.
But when I found QGIS, an open-source application to analyze geospatial information, I couldn’t help but to peek in. I had my media player, would I be able to find free music? -I found not a bit, but a mountain of climate, wildlife, land, and geological data, not only from governmental and non-governmental organizations alike, but also crowd-sourced from people like you and me.
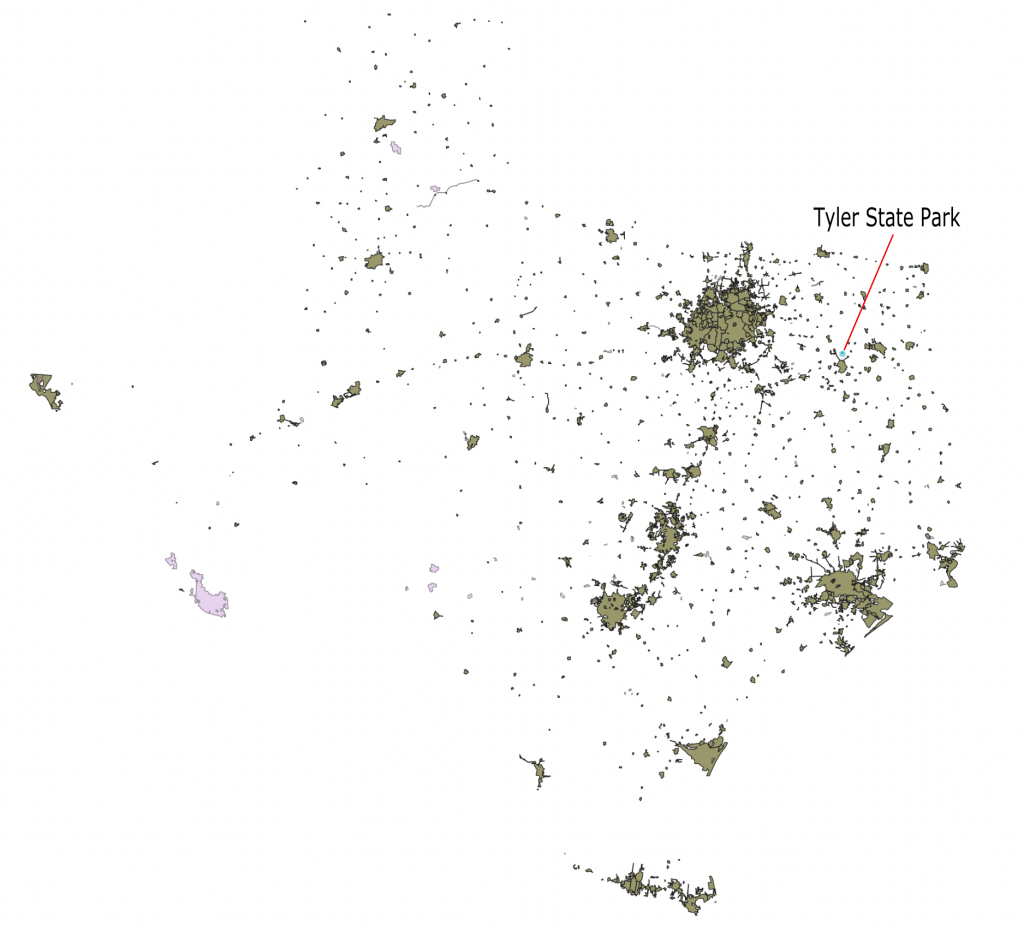
The first step to making sense of something overwhelming is to start small. I find it much easier to learn something new by setting an objective and then attempting to achieve it. Thus I found a little state park in North East Texas called Tyler State Park, and my first mission was to provide a description of the park.
Objective: Provide a detailed description of Tyler State Park
Tyler State Park resides in Smith County, TX. Vector data from the Texas Department of Transportation for city boundaries shows that it is surrounded by 3 cities: Tyler (pop. 96900), Lindale (pop. 4818), and Winona (pop. 576).
Geospatial information software digests several data formats, including vector and raster data formats. Vector data looks like maps, while raster data looks like pictures. Vector data will tell you about the land and its elements, like its trails, rivers, and borders; raster data will tell you about its elevation, like the trail’s gradient and aspect measurements – how much it slopes and whether it faces North, South, East, or West.
Geospatial information software uses coordinate reference systems (CRS), a feature from the field of cartography. Because the earth is a 3-dimensional object, yet mostly drawn on a flat piece of paper, there are various map projections, thus different coordinate reference systems, to depict the earth to fit our purpose. I used “EPSG:2276 Texas North Central” project coordinate reference system; all vectors and rasters were converted into this CRS in order to be compatible with each other.
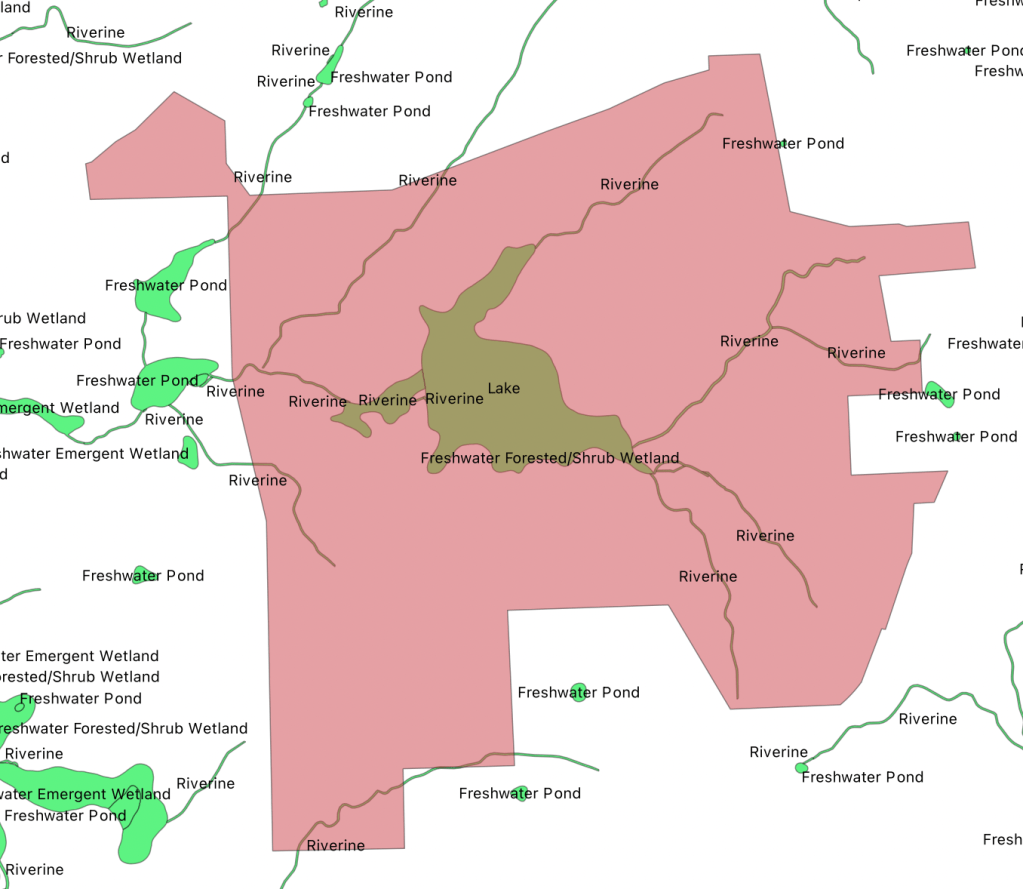
Tyler State Park is in the National Wetlands Inventory, called Tyler SW wetlands. Major features include its central lake (area 59.468 acres) and riverine.
Vector data provided by the USDA shows that Tyler State Park is within Ecoregion 94: a humid temperate domain, subtropical division, mixed forest province, in the mid coastal plains section. Ecoregions are large areas of similar climate where ecosystems recur in predictable patterns. The ecoregion classification system includes four levels of detail: the largest are domains, which are groups of related climates and differentiated based on precipitation and temperature. Divisions represent the climates within domains and are differentiated based on precipitation levels and patterns as well as temperature. Divisions are subdivided into provinces, which are differentiated based on vegetation or other natural land covers. The finest level of detail is described by subregions, called sections, which are subdivisions of provinces based on terrain features.
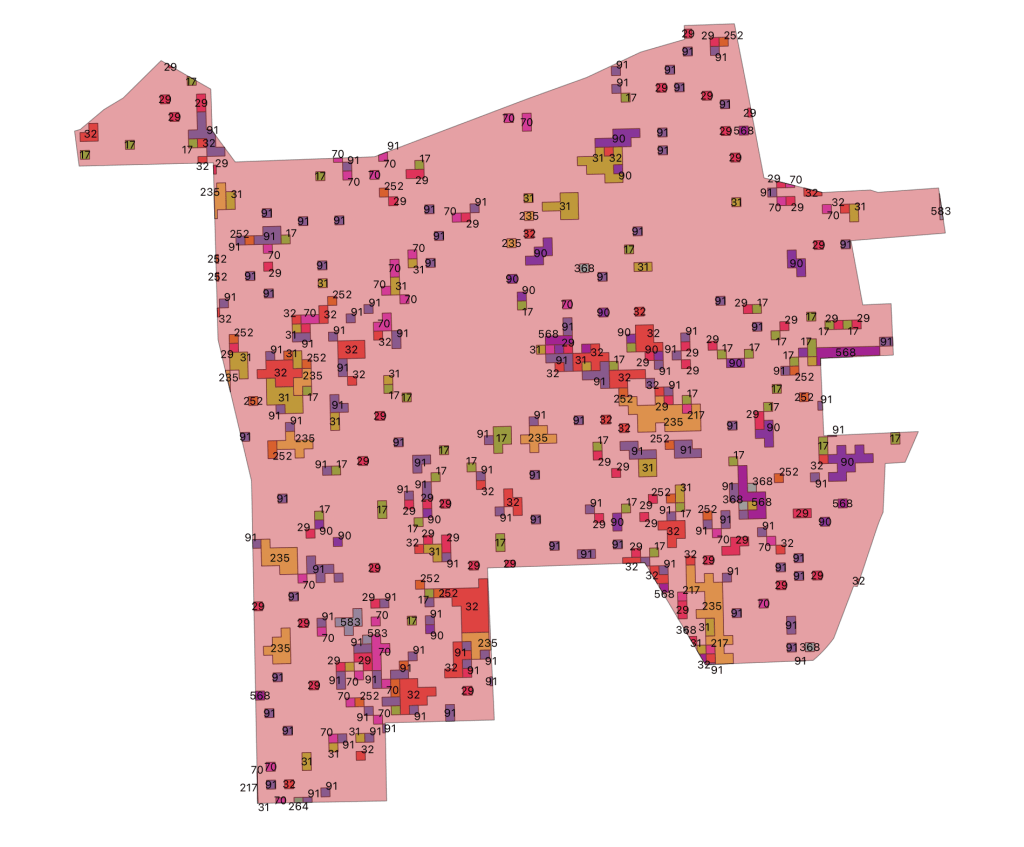
We can download OCONUS land cover data from the USGS, which includes detailed vegetation and land cover patterns. The dataset incorporates the ecological system classification by NatureServe. Land cover data is a part the USGS’s gap analysis project, which also provides data for wild life species and terrestrial and marine protected areas. Tyler State Park consists of the following vegetation classification:
| Class | Ecological System | Total Area (Sq-ft) |
| 17 | West Gulf Coastal Plain Upland Longleaf Pine Forest and Woodland | 48683.444 |
| 29 | West Gulf Coastal Plain Mesic Hardwood Forest | 64423.807 |
| 31 | West Gulf Coastal Plain Pine-Hardwood Forest | 66573.754 |
| 32 | West Gulf Coastal Plain Sandhill Oak and Shortleaf Pine Forest and Woodland | 100877.825 |
| 70 | East-Central Texas Plains Post Oak Savanna and Woodland | 36253.519 |
| 90 | Managed Tree Plantation | 43200.013 |
| 91 | Ruderal forest | 149262.777 |
| 217 | Atlantic Coastal Plain Small Brownwater River Floodplain Forest | 2730.858 |
| 235 | West Gulf Coastal Plain Small Stream and River Forest | 84658.149 |
| 252 | West Gulf Coastal Plain Pine-Hardwood Flatwoods | 21189.513 |
| 264 | West Gulf Coastal Plain Wet Longleaf Pine Savanna and Flatwoods | 522.9 |
| 368 | West Gulf Coastal Plain Southern Calcareous Prairie | 3754.491 |
| 568 | Harvested Forest-Shrub Regeneration | 22832.014 |
| 583 | Developed, Medium Intensity | 5894.463 |
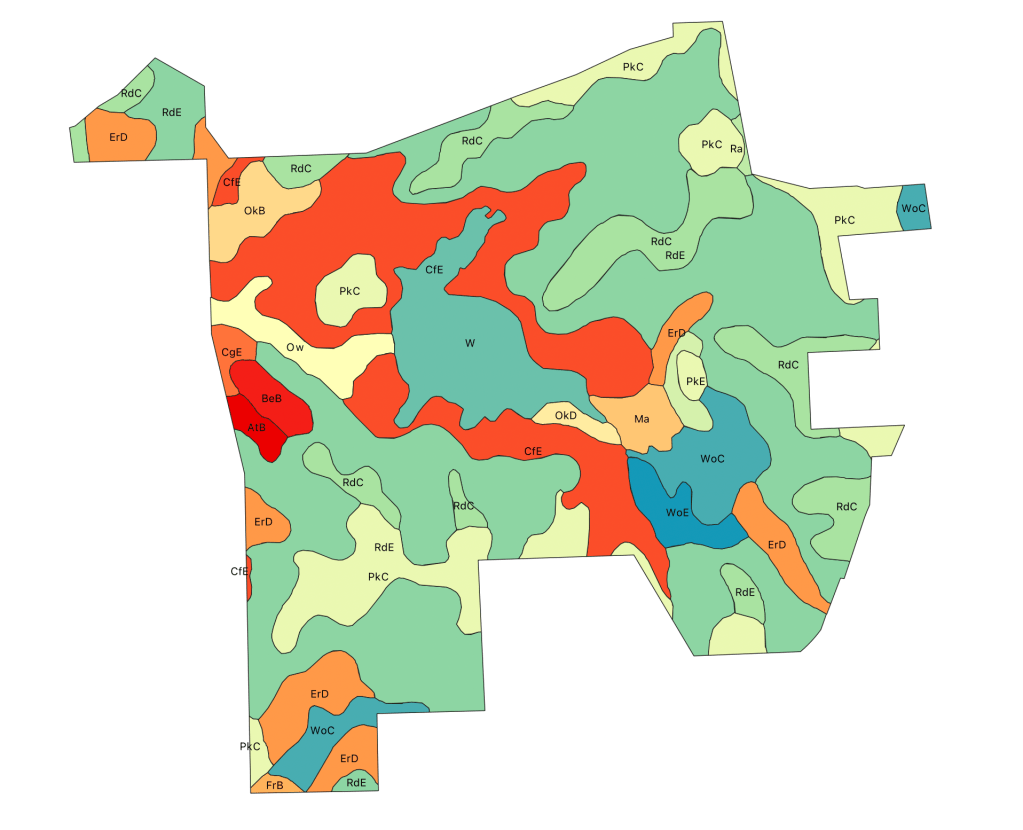
The USDA provides soil survey information by Geographic data (SSURGO) in vector data format. It also provides literature explaining different soil compositions for Smith County. Tyler State Park is of the following soil compositions:
| Class | Description | Total Area (sq-ft) |
| AtB | Attoyac fine sandy loam, 1-3% slopes | 21561.93 |
| BeB | Bernaldo fine sandy loam, 1-3% slopes | 36741.06 |
| CfE | Cuthbert fine sandy loam, 5-20% slopes | 626857.94 |
| CgE | Cuthbert gravelly fine sandy loam, 5-20% slopes | 19562.50 |
| ErD | Elrose fine sandy loam, 3-8% slopes | 237213.38 |
| FrB | Freestone fine sandy loam, 1-3% slopes | 7899.44 |
| Ma | Mantachie loam, frequently flooded | 44068.83 |
| OkB | Oakwood fine sandy loam, 1-5% slopes | 61092.97 |
| OkD | Oakwood fine sandy loam, 5-8% slopes | 18854.70 |
| Ow | Owentown loamy fine sand, occasionally flooded | 73991.32 |
| PkC | Pickton loamy fine sand, 1-6% slopes | 450698.69 |
| PkE | Pickton loamy fine sand, 8-15% slopes | 22780.06 |
| Ra | Raino fine sandy loam, 0-2% slopes | 4251.91 |
| RdC | Redsprings very gravelly fine sandy loam, 2-5% slopes | 365212.41 |
| RdE | Redsprings very gravelly fine sandy loam, 8-25% slopes | 1571998.04 |
| WoC | Wolfpen loamy fine sand, 1-6% slopes | 167919.04 |
| WoE | Wolfpen loamy fine sand, 8-15% slopes | 54192.19 |
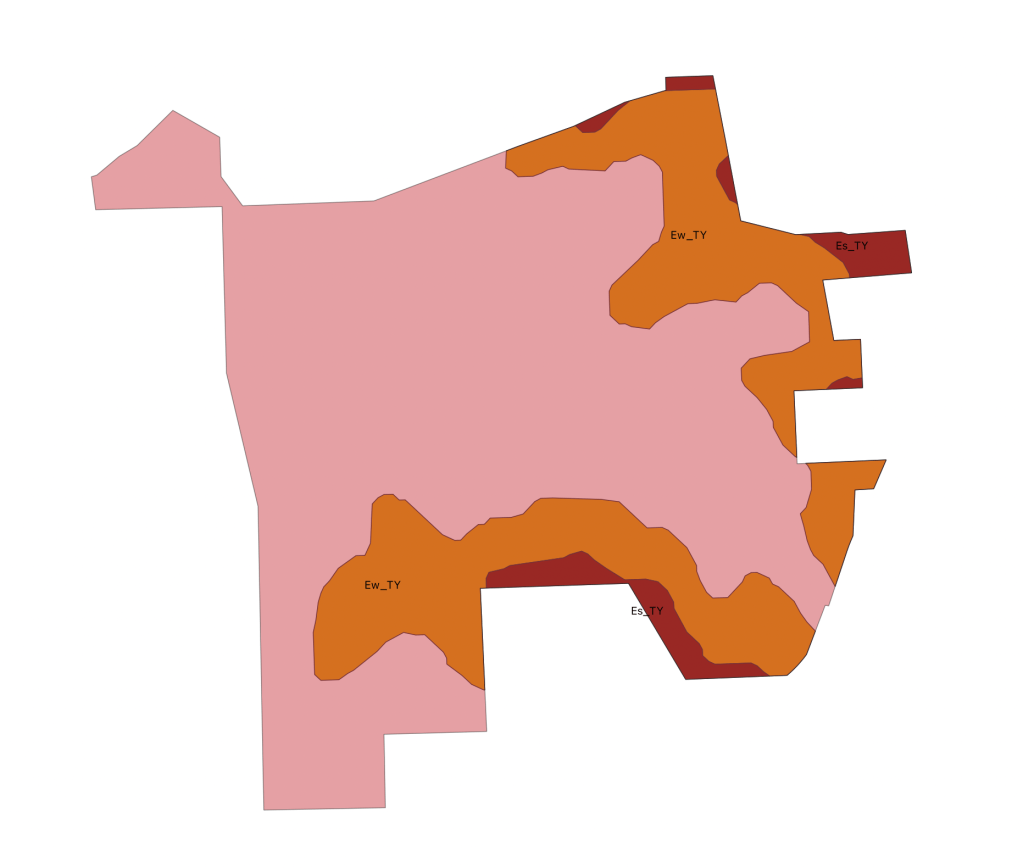
The Texas Natural Resources Information System(TNRIS) archives natural resources data for the state of Texas. Together with the USGS, the TNRIS provides data for surface geology. Tyler State Park contains the following rock compositions:
| Rock Unit | Total Area (sq-ft) | Name | Description | Period/Epoch |
| Es | 153597.32 | Sparta Sand | Quartz sand, fine to medium grained, light gray to brownish gray, slightly cohesive from silt and clay matrix, massive, locally cross-bedded, interbeds of sandy clay more abundant upward, locally carbonaceous; weathers various shades of light gray, at base hard, brown, ferriginous sandstone; lower part 170+/- feet thick, upper part absent. Locally includes Tyler Green-sand Member, Etg, quartz-glauconite greensand, grayish green, massive, locally cross-bedded; weathers dark reddish brown, abundant ironstone concretions | Tertiary Eocene |
| Ew | 1075980.07 | Weches Formation | Glauconite and quartz sand, grayish green to grayish olive green, thin bedded, locally cross-bedded to lenticular, clay interbeds light brown to moderate light gray, silty, muscovitic, thin bedded; weathers moderate to dark reddish brown, locally forms limonitic and sideritic iron ore and clay ironstone concretions; marine megafossils in southern part; 35+/- feet thick, range 0-70 feet | Tertiary Eocene |
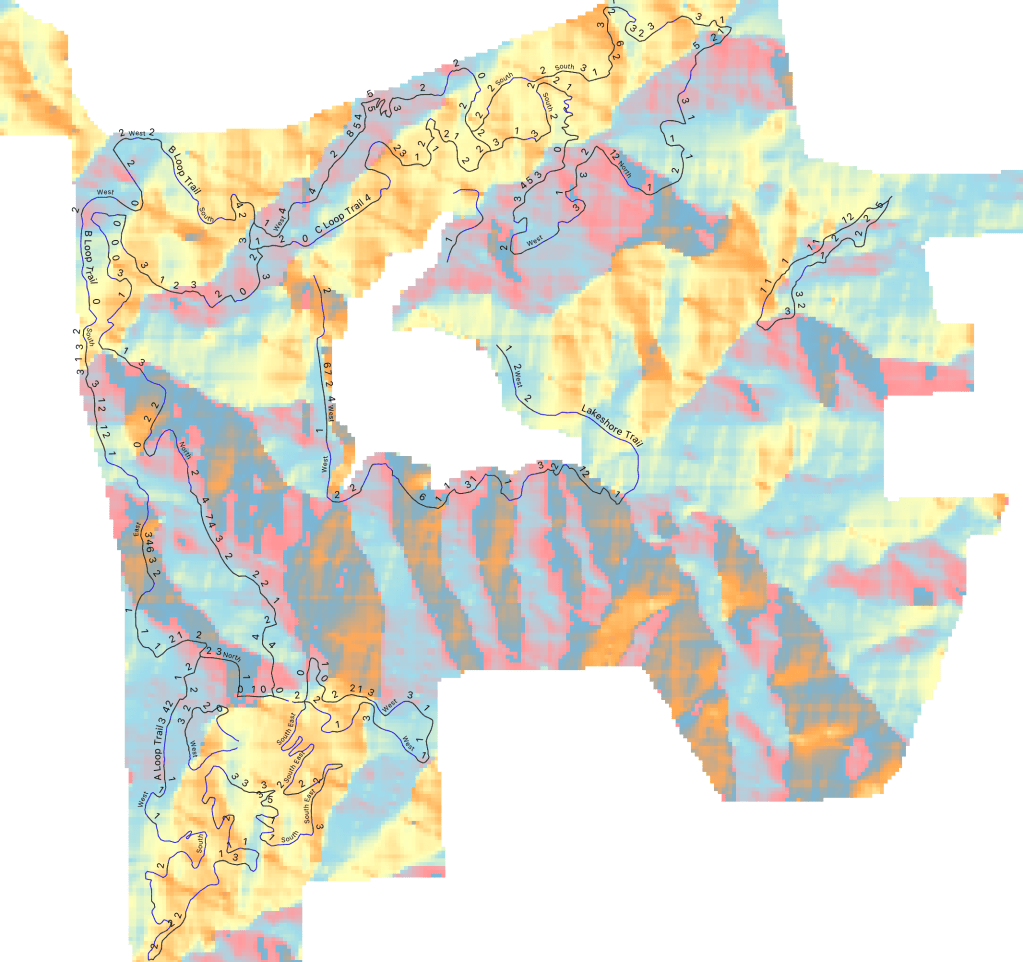
The digital elevation model (DEM) represents a terrain’s elevation information. The USGS provides DEM models to generate elevation rasters for aspect and slope computation. Trails information from the Texas Parks and Wildlife Department can be imported into Google Earth to convert into kml format for QGIS processing. The graphic below displays aspect and slope information for the hiking trails on an aspect raster background. Aspect values are simplified from a range of [0-360°] to North(dark blue/pink)-East(orange)-South(yellow)-West(light blue); slope unit is in degrees.
There were yet other information that I hadn’t explored for the park. However, at this point, I felt confident about my knowledge upon Tyler State Park to explore my next objective. Say I wanted to rehabilitate a certain plant species X. For plant X to thrive, certain requirements must be met.
Objective: Locate suitable locations within Tyler State Park to rehabilitate plant species X, which is a part of the West Gulf Coastal Plain Small Stream and River Forest ecological system (ID235), with the following criteria:
1. Soil type: Pickton loamy fine sand, 8-15% slopes (PkE) or Redsprings very gravelly fine sandy loam, 8-25% slopes(RdE)
2. North facing slope no more than 2 degrees
3. Minimum 100 ft away from trails
4. Minimum 2000 sq-ft planting surface
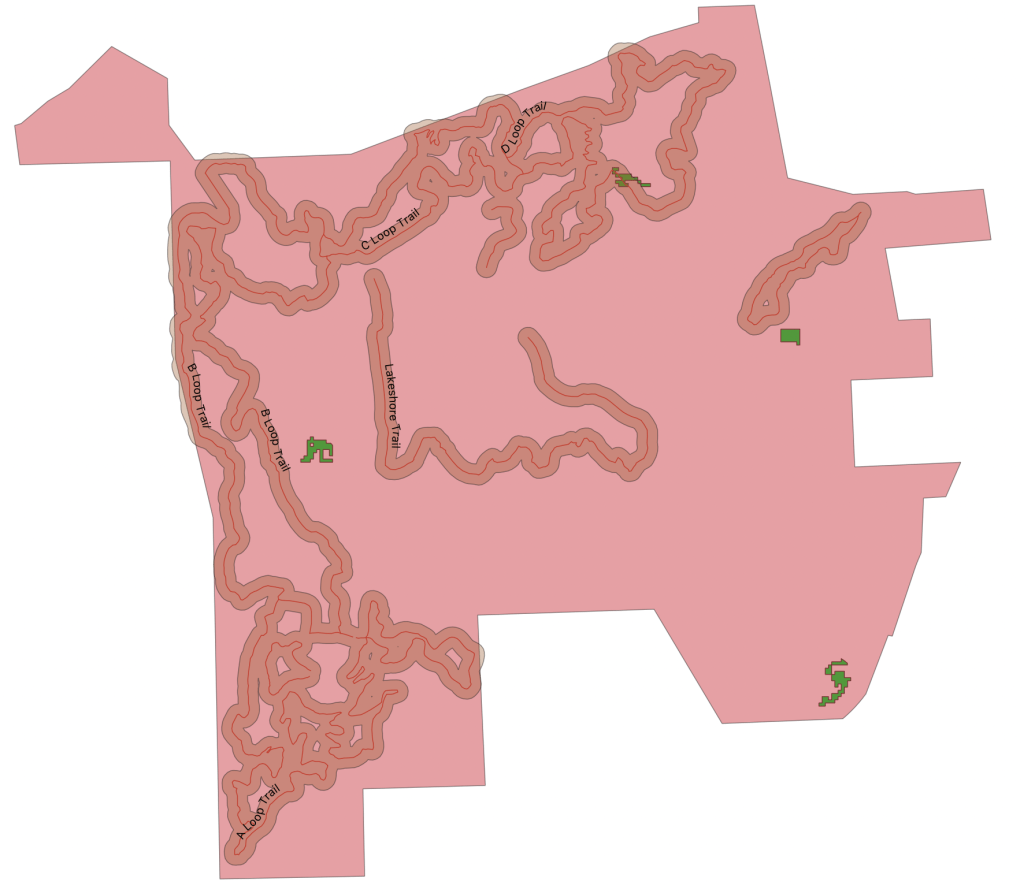
For the first criteria, we would take advantage of the soil survey data and filter for the required soil conditions. For the second criteria, we would use the elevation data to locate desirable locations. For the third criteria, we would draw polygons around the trails and find locations that did not overlap the polygons. For the last criteria, we would compute the areas of our final candidates to find the most suitable ones.
Suitable locations were the green polygons not overlapping with trails, of which there were three.
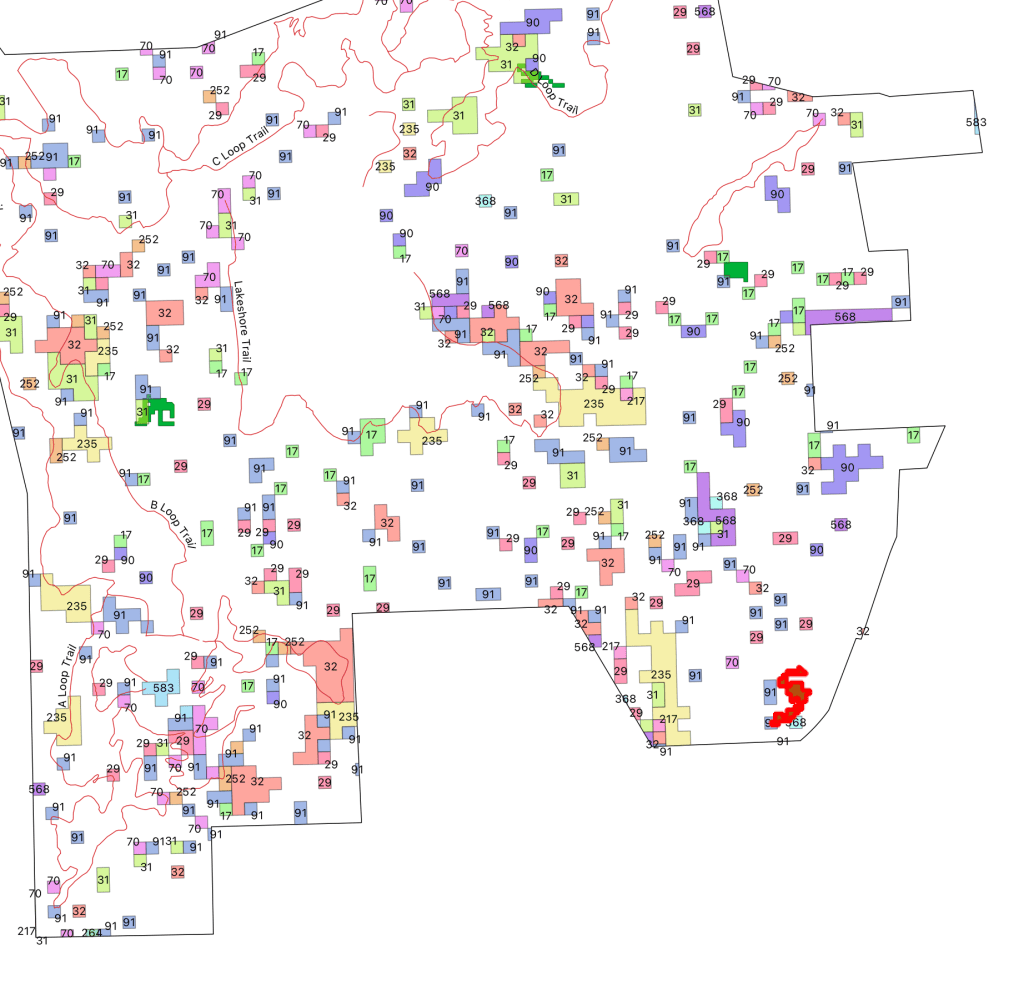
Finally, to choose the most suitable location, we would use our data for land cover and pick the largest and most vacant lot, so as not needing to clear others in order to plant X. Among the three, the best location was the lot at the South East corner, marked in red color.
This is a small example of how I was able to use open-source information to answer a question. Utilizing the same techniques may help tackle the greater challenge of rehabilitating not only plants but other wildlife species. There are other resources and technologies that can help track wildlife movements and progresses. Combined, they can help to better decision making and management. Together, we can hope to develop a comprehensive approach to understanding the natural life around us.
We were told that to get ahead in life, figure out what’s keeping the most important people up at night and solve it for them. But I think the more interesting proposition starts with YOU. The world is at your fingertip; what are you interested in solving?
